

The Disconnect
Every company has a pricing page that lists what it sells. Features, capabilities, packages, service tiers. The descriptions are accurate. The pricing is clear. The product does what the product page says it does.
And yet, when you ask customers what they bought, they describe something else entirely.
A project management tool’s pricing page sells task tracking, team collaboration, and workflow automation. Its customers bought accountability, the ability to see who’s doing what, and the feeling that things won’t fall through the cracks. A consulting firm’s website sells strategy, transformation, and implementation. Its clients bought confidence, the ability to walk into a board meeting and say, “We’ve had this independently validated.” A CRM company sells contact management and pipeline visibility. Its customers bought control, the sense that they know what’s coming next quarter.
The feature is what ships. The transformation is what sells. And most companies build their entire positioning around the feature.
The Milkshake Problem
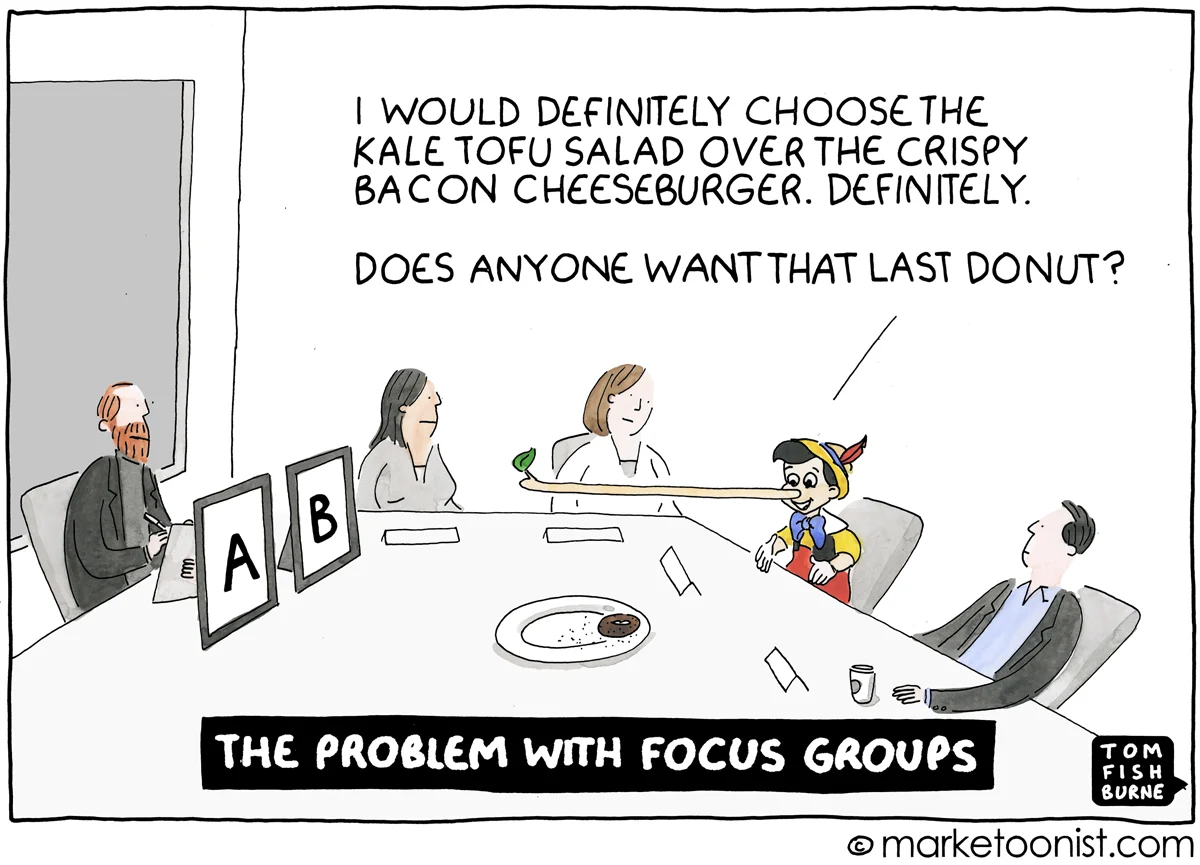
The clearest illustration of this disconnect comes from Clayton Christensen’s jobs-to-be-done research. A fast-food chain wanted to improve milkshake sales. They ran the standard playbook: demographics, taste preferences, price sensitivity, and focus groups. They made changes based on the findings. The impact on sales was zero.
Christensen’s team took a different approach. They observed. They discovered that approximately 40-50% of milkshakes were sold before 8:30 AM to solo commuters, who consumed them in their cars. The “job” being hired wasn’t hunger or taste. It was making a boring commute interesting and staying full until 10 AM. The milkshake’s real competitors were bananas, bagels, and Snickers bars — not other milkshakes.
The company had been optimizing product attributes (Quadrant 2, what it actually sells) based on stated customer preferences (Quadrant 3, what customers say they buy). The actual purchase decision (Quadrant 4, what customers actually buy) was invisible to both the company and customers. The commuters didn’t wake up thinking “I need a thick, viscous liquid that takes 23 minutes to consume through a thin straw.” They thought, “I need something to make this drive bearable.”
This is the fundamental challenge: the most important quadrant is the one neither side can articulate.
The Four Quadrants
The disconnect between what companies sell and what customers buy isn’t random. It follows a consistent pattern, and it can be mapped across four dimensions.
Quadrant 1: What the company thinks it sells. This is the positioning (what I call framing) you’ll find on the website, in the pitch deck, and in the CEO’s keynote. It’s the internal consensus about what the company does and why it matters. It is almost always the most polished quadrant and the most disconnected from reality — not because it’s wrong, but because it reflects intention rather than impact.
Quadrant 2: What the company actually sells. Strip the marketing (framing). Look at the pricing page, the contract terms, the support SLAs, the cancellation policy, the feature prioritization decisions, and the resource allocation. These operational signals reveal what the company actually prioritizes. And what a company prioritizes, not what it says it prioritizes, is what it sells. Companies that talk about innovation but invest in reliability are selling reliability. Companies that talk about partnership but charge for every support interaction are selling a transactional product. The operational decisions don’t lie.
Quadrant 3: What customers say they buy. Go to G2, Trustpilot, Reddit, LinkedIn, and Glassdoor. Read what customers tell each other — not what they tell the company in an NPS survey or a feedback form. Unprompted customer language from uncontrolled sources reveals how the market actually frames the value exchange. The vocabulary customers use when no one from the company is listening is the truest signal of the company’s actual position.
Quadrant 4: What customers actually buy. This is the deepest quadrant and the hardest to see. Customers don’t buy products. They buy the version of themselves or their business that becomes possible after purchase. They buy status, safety, certainty, speed, belonging, control, or transformation. The product is the vehicle. The Quadrant 4 purchase is the destination.
Chris Argyris and Donald Schon at Harvard demonstrated why Quadrant 4 is invisible, even to those making the purchase. Their research on espoused theory versus theory-in-use (1974, Jossey-Bass) showed that the theory that actually governs a person’s actions differs systematically from the theory they say governs their actions. The critical insight: “Few people are aware that the maps they use to take action are not the theories they explicitly espouse.” Customers can’t tell you their Quadrant 4 motivation because they don’t have conscious access to it. The rationale they articulate for the purchase is their espoused theory. The actual decision driver is their theory-in-use — and it operates below the threshold of self-report.
Where the Gap Lives
When all four quadrants align, the company has positioning gravity. What it claims to sell, what it actually sells, what customers say they buy, and what customers actually buy all point to the same concept. The company owns a noun in the market’s mind. Its position is structural, hard to copy, and self-reinforcing.
When the quadrants diverge, and they diverge in most companies, the perception gap emerges. And the gap doesn’t stay neutral. It compounds.
The most common pattern: Quadrant 1 (what the company thinks it sells) is aspirational. Quadrant 2 (what it actually sells) is operational. Quadrant 3 (what customers say they buy) reflects the operational reality more than the aspiration. And Quadrant 4 (what customers actually buy) is invisible to everyone.
The company builds its strategy on Quadrant 1. Customers make their decisions based on Quadrants 3 and 4. The gap between those two reference points is where deals die, campaigns underperform, and competitors win by saying less but proving more.
What Building on the Wrong Quadrant Costs
A company that builds a strategy on Quadrant 1, its own stated narrative, invests in messaging, brand campaigns, and content that reinforces what it wants to be true. When the market doesn’t respond, the company concludes it needs better messaging. More campaigns. A new agency. A rebrand.
But the problem was never the message. The problem was that the message was built on the wrong quadrant.
The evidence for what happens when companies optimize the wrong quadrant is expensive. Tropicana invested $35 million in a redesign that reflected what the company wanted the brand to become (Quadrant 1) rather than what customers associated it with (Quadrants 3 and 4). Sales fell 20% within two months. Total damage exceeded $50 million. Quaker Oats bought Snapple for $1.7 billion and applied Gatorade’s distribution strategy (Quadrant 2 logic) to a brand whose value existed entirely in Quadrant 4 — quirky independence, cultural identity, and an anti-corporate sensibility. Three years later, they sold it for $300 million. A $1.4 billion perception gap.
Gap replaced its logo without testing, optimizing for what the internal brand team wanted (Quadrant 1) without checking what customers associated with the existing mark (Quadrant 3). Six days and approximately $100 million later, they reverted.
In every case, the company was not incompetent. It was measuring the wrong quadrant.
A company that builds a strategy on Quadrant 4, which customers actually buy, makes fundamentally different decisions. Its messaging reflects the transformation customers recognize. Its product investments reinforce the value customers came for. Its positioning targets the concept customers associate with the purchase, not the features the company is proud of.
The difference between building on the right quadrant and the wrong one is the difference between compounding positioning gravity and accelerating a perception gap.
What Executives Actually Buy When They Buy Research
The quadrant disconnect applies to the research industry itself. When a CEO commissions a brand tracking study or a strategy engagement, the Quadrant 1 narrative is “we’re buying insight to make better decisions.” The Quadrant 4 reality is often different.
Research on defensive decision-making shows that executives frequently choose less effective but lower-risk alternatives over options that are in the best interests of their organization (British Journal of Occupational and Organizational Psychology). “Nobody gets fired for hiring McKinsey” is not a statement about McKinsey’s analytical quality. It is a statement about the career risk calculus of the person signing the check.
Moorman, Zaltman & Deshpande (1992, Journal of Marketing Research, 779 respondents) found that trust and perceived quality of interaction contribute most significantly to research utilization, not the research findings themselves. Firms invest in the research process as a mechanism for managing anxiety. Forrester characterized most business intelligence efforts as “data to insight to hoping for action.”
This is the meta-perception-gap: companies buying Quadrant 1 research (what the firm claims it delivers) while the actual purchase is Quadrant 4 (confidence, political cover, career risk reduction). The research itself is subject to the same sell-versus-buy disconnect as every other product.
How to Find Out Which Quadrant You’re Actually In
The challenge is that you can’t map your own quadrants from inside the company. Quadrant 1 is obvious; it’s your website. Quadrant 2 requires an honest operational audit. But Quadrants 3 and 4 require evidence from outside the building — from sources you don’t control and can’t edit.
The Gap Analyzer provides a free initial read. It compares your public-facing claims against uncontrolled customer signals and shows you where the disconnect begins.
For the full four-quadrant map, with scored gaps, a Customer Language Library, and a Competitive Perception Map, Monopoly analyzes 75+ data sources and delivers the complete perception intelligence in under 8 minutes.
The companies that outperform aren’t the ones with the best Quadrant 1 narrative. They’re the ones who know which quadrant their customers are actually in and build from there.
Related:
Leave a Reply
You must be logged in to post a comment.